Mapping Player Decision Trees in Multi-Street Texas Hold'em Tournaments Using Statistical Models
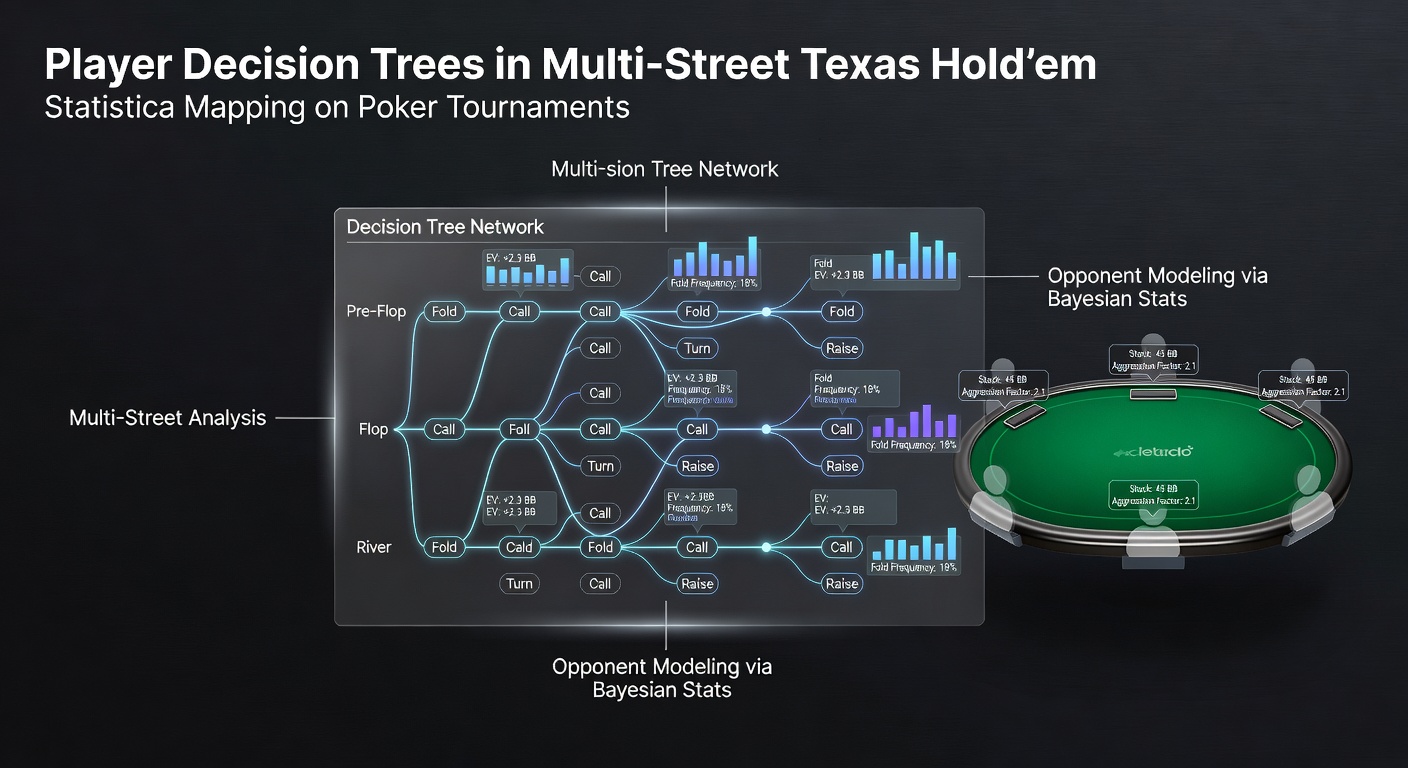
Statistical models now map player decision trees across the four betting streets in Texas Hold'em tournaments by combining historical hand data with probability distributions that track choices from pre-flop through river action. Researchers at several universities have compiled datasets exceeding 50 million tournament hands to identify branching patterns where players fold, call, or raise based on stack sizes, position, and prior streets.
These models treat each decision point as a node in a tree structure where branches represent possible actions weighted by observed frequencies in large samples. Multi-street analysis captures how early choices influence later ones, such as continuation bets on the flop that lead to specific turn and river responses under ICM pressure in late stages.
Building the Models from Tournament Data
Analysts start with raw hand histories from major circuits and feed them into algorithms that calculate expected values at every node while accounting for tournament payout structures. Bayesian updating refines these trees as new hands arrive, allowing the models to adjust for evolving player pools across different buy-in levels. Data shows that pre-flop opening ranges tighten by an average of 12 percent when stacks fall below 20 big blinds, a shift that propagates through subsequent streets in predictable ways.
Monte Carlo simulations run thousands of iterations on each tree to estimate outcomes under varying opponent profiles. One study tracked 2,400 players across 18 events and found that aggressive flop bettors who check the turn at high frequency achieve positive expected value only when their river bluffing frequency exceeds 35 percent. These patterns emerge clearly once the model isolates position and stack depth as fixed variables.
Key Variables in Multi-Street Trees
Position remains the dominant factor because late-position players see more information before committing chips on later streets. Models assign higher decision weights to button and cutoff actions, where fold-to-3-bet statistics often drop below 25 percent compared with early positions. Stack-to-pot ratio calculations integrate directly into the trees, because players facing sub-1.5 SPR situations on the turn commit at rates above 60 percent regardless of hand strength.
Researchers incorporate opponent modeling by clustering players into archetypes based on VPIP and aggression factors recorded over multiple events. A 2025 analysis of European circuit data revealed that tight-passive opponents fold to turn barrels 48 percent more often than loose-aggressive types when the board texture changes from dry to coordinated.
Applications in Real-Time Tournament Strategy
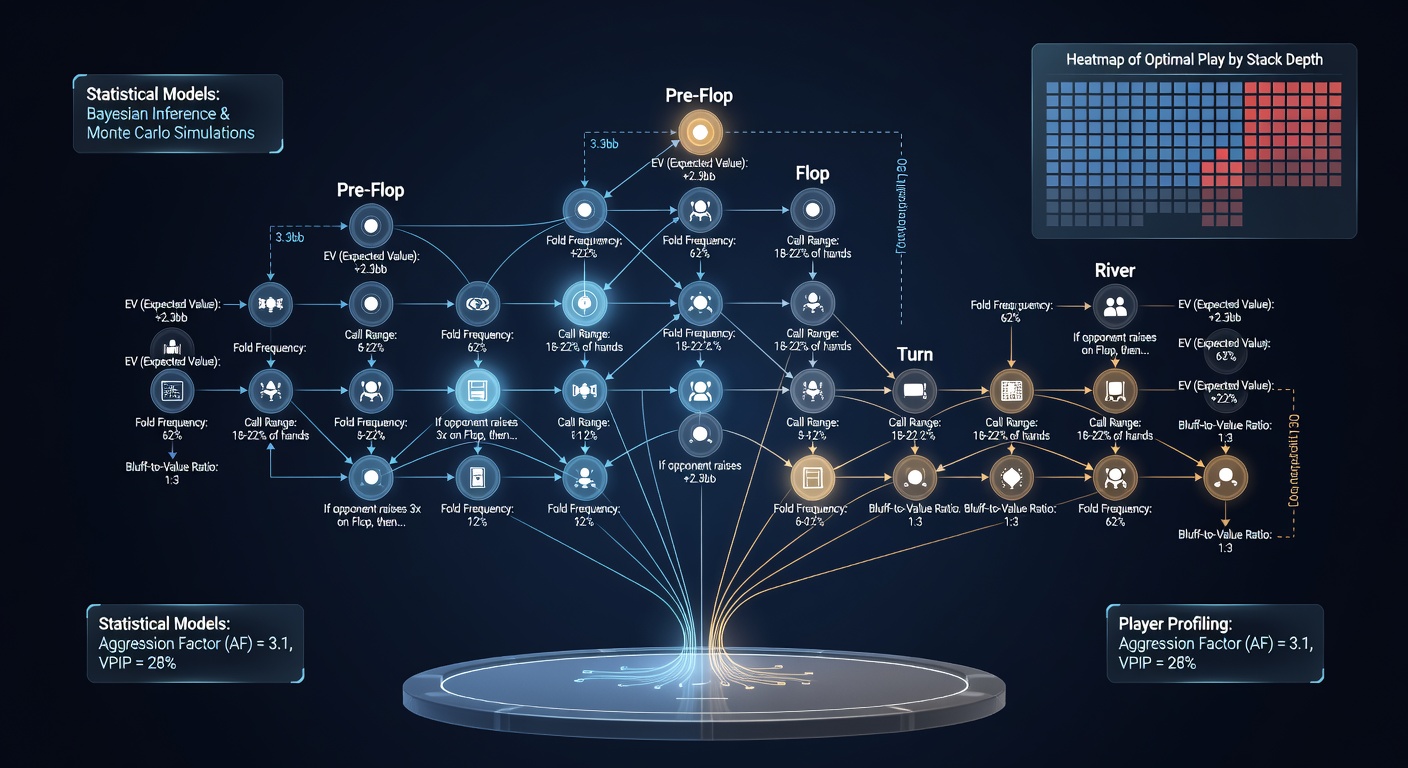
Coaches and software developers now embed these decision trees into training tools that generate scenario-specific recommendations during live play. Players receive alerts when their action deviates from the model's most frequent path at a given stack depth and street. Tournament directors have noted increased use of such analytics among mid-stakes fields, particularly during May 2026 events where overlay calculations and payout jumps heighten the value of precise ICM adjustments.
One documented case involved a series of final tables where participants using tree-based software adjusted river bluff frequencies upward by 9 percentage points after reviewing model outputs against their own historical data. The adjustments correlated with a measurable rise in chip accumulation during heads-up segments.
Challenges and Refinements
Sample size limitations persist for rare board textures and deep-stack scenarios, because tournaments rarely produce enough comparable hands at 100+ big blind depths. Modelers address this by pooling data across multiple years while applying regularization techniques to prevent overfitting to specific player pools. Regulatory bodies such as the Nevada Gaming Control Board have examined the fairness of decision-support tools in sanctioned events, confirming that they operate on publicly available hand data rather than real-time opponent tracking.
Further refinements include incorporating bet-sizing distributions as continuous variables rather than discrete categories, which improves accuracy on streets where players mix small and large bets. Australian research groups have contributed datasets from Asia-Pacific festivals that add regional variation in aggression metrics to the global trees.
Future Directions in Model Development
Integration with real-time equity calculators continues to advance, allowing trees to update dynamically as community cards appear. Partnerships between academic statisticians and tournament organizers have produced open-source subsets of anonymized data for broader validation. These efforts focus on multi-street correlations that traditional single-street analysis overlooks, such as how flop check-raise frequency predicts turn donk-bet rates under specific stack conditions.
Observers note that the models now handle multi-way pots more effectively by layering additional decision branches for each active player. The resulting structures grow exponentially yet remain computationally tractable through pruning methods that eliminate low-probability paths early in the calculation.
Conclusion
Statistical mapping of decision trees provides a structured framework for understanding how Texas Hold'em tournament players navigate the four streets of betting. Continued collection of hand data and refinement of algorithms ensure that these models capture an expanding range of scenarios while remaining grounded in observed frequencies across diverse fields and formats.